
Group Earnings
- 2015 was a new record year for ProSiebenSat.1, with revenues growing by 13.4 % to EUR 3.261 billion.
- ProSiebenSat.1 grows extremely solid in its core business of free TV, the Digital & Adjacent and Content Production & Global Sales segments develope dynamically, generating 34.0 % of consolidated revenues.
- Recurring EBITDA also reaches a new high of EUR 925.5 million, with underlying net income again exceeding the prior-year level despite higher tax expenses.
- The financial result improves as a result of lower interest expenses, reflecting the Group’s proactive financial management.
In 2015, ProSiebenSat.1 Group increased its consolidated revenues to EUR 3.261 billion. This corresponds to a year-on-year increase of 13.4 % or EUR 385.0 million. All segments contributed to this development:
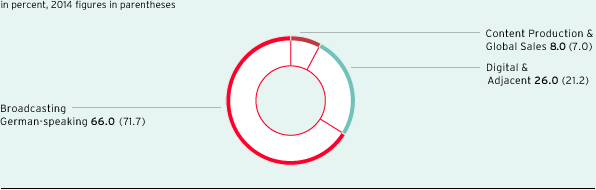
- The Broadcasting German-speaking segment with the core business of advertising-financed TV recorded external revenue growth of 4.3 % or EUR 89.3 million to EUR 2.152 billion. This corresponds to a share in consolidated revenues of 66.0 % (previous year: 71.7 %).
- The Digital & Adjacent segment increased its revenues by 38.6 % or EUR 235.7 million to EUR 846.4 million, again making the highest growth contribution. Acquisitions reinforced the profitable revenue growth in the Digital & Adjacent segment.
- The Content Production & Global Sales segment also grew dynamically. It mainly generated organic growth, increasing its revenue contribution by EUR 60.0 million or 29.7 % to EUR 262.2 million.
The Group’s target is to become more independent from the core business of advertising-financed TV and especially to use additional revenue potential in the digital industry. This reflects the development of revenue shares by segment: In 2015, ProSiebenSat.1 Group continued to significantly increase the share of the two segments Digital & Adjacent and Content Production & Global Sales in consolidated revenues. Altogether, they contributed 34.0 % or EUR 1.109 billion to consolidated revenues, compared with 28.3 % or EUR 812.9 million in the previous year.
Group revenue share by segment

Other operating income amounted to EUR 24.7 million after EUR 27.9 million in the previous year.
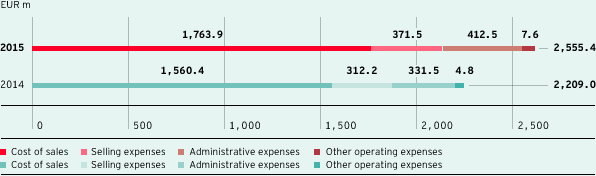
ProSiebenSat.1 Group invests in markets with long-term prospects for growth and synergies. As a result, total costs again increased across all segments. They totaled EUR 2.555 billion, an increase of 15.7 % or EUR 346.4 million compared to financial year 2014. Total costs, which comprise the cost of sales, selling expenses, administrative expenses and other operating expenses, were influenced by the following factors:
- The majority of the cost increase was due to a rise in the cost of sales by 13.0 % or EUR 203.4 million to EUR 1.764 billion. On the one hand, this was due to the expansion of the digital portfolio, with initial consolidations of various digital platforms in particular having an impact on the cost level. On the other hand, cost development was impacted by the larger business volume in the Content Production & Global Sales segment. Production business grew substantially in 2015, especially in the US.
The consumption of programming assets — the Group’s largest cost item — increased to EUR 895.5 million (previous year: EUR 867.8 million). This includes impairments of programming assets amounting to EUR 99.4 million (previous year: EUR 56.4 million). - Selling expenses increased by 19.0 % or EUR 59.3 million to EUR 371.5 million. The increase in selling expenses also primarily reflects the portfolio expansion in the Digital & Adjacent segment. In addition to acquisitions, cost development was influenced by growth in the areas of Ventures & Commerce and video-on-demand (VoD). The Broadcasting German-speaking segment also saw a cost increase due to higher revenues.
- Administrative expenses also increased significantly in the wake of the Group’s growth. They amounted to EUR 412.5 million; this equates an increase of 24.4 % or EUR 80.9 million. One of the reasons for the rise in administrative expenses was the higher level of personnel expenses as a result of the acquisitions made.
- Other operating expenses increased by EUR 2.8 million to EUR 7.6 million.
Total costs

The Group has made various acquisitions in the past few months. In addition to the aforementioned effects, the development of total costs was therefore also impacted by amortization from purchase price allocations and non-recurring items. Operating costs adjusted for depreciation, amortization and non-recurring expenses amounted to EUR 2.355 billion (previous year: EUR 2.047 billion). This corresponds to an increase of 15.0 % compared to financial year 2014. A reconciliation of operating costs from total costs is shown in the following table; the operating costs are the cost items that are relevant for recurring EBITDA:
Reconciliation of operating costs |
||||||
|
|
|
||||
EUR m |
2015 |
2014 |
||||
|
||||||
Total costs |
2,555.4 |
2,209.0 |
||||
Non-recurring expenses |
49.7 |
38.2 |
||||
Depreciation and amortization1 |
151.1 |
123.8 |
||||
Operating costs |
2,354.5 |
2,046.9 |
||||
For ProSiebenSat.1 Group, recurring EBITDA adjusted for non-recurring items is a central key performance indicator for managing profitability. It increased to EUR 925.5 million as a result of the revenue momentum (previous year: EUR 847.3 million). This represents year-on-year growth of 9.2 %.
The corresponding recurring EBITDA margin was 28.4 % (previous year: 29.5 %). The Broadcasting German-speaking segment with advertising-financed free TV business is characterized by an unchanged high margin of 33.0 % (previous year: 32.9 %) and is growing solidly. At the same time, the share of the Digital & Adjacent and Content Production & Global Sales segments in the Group’s recurring EBITDA increased compared to the previous year as planned: They grew profitably and saw a significant double-digit increase in their earnings contribution; the segments accounted for recurring EBITDA of EUR 170.2 million (previous year: EUR 129.3 million) or EUR 25.0 million (previous year: EUR 19.1 million). In light of the higher absolute contribution of these two segments and its lower margin profile compared to the Broadcasting German-speaking segment, the Group’s adjusted earnings margin declined slightly by 1.1 percentage points overall. Their margins diverge because of differences in the business models or earnings and cost structures and, in some cases, the degree of maturity of the individual portfolio companies, among others.
Consolidated EBITDA increased by 7.7 % to EUR 881.1 million (previous year: EUR 818.4 million). It includes non-recurring items of EUR 44.4 million (previous year: EUR 28.9 million), which are mainly the result of M&A measures. A reconciliation of the operating earnings figures is as follows:
Reconciliation of recurring EBITDA from continuing operations |
||||||||
|
|
|
||||||
EUR m |
2015 |
2014 |
||||||
|
||||||||
Result before income taxes |
603.6 |
560.1 |
||||||
Financial result |
-126.4 |
-134.4 |
||||||
EBIT |
729.9 |
694.5 |
||||||
Depreciation and amortization1 |
151.1 |
123.8 |
||||||
Thereof from purchase price allocations |
32.3 |
19.9 |
||||||
EBITDA |
881.1 |
818.4 |
||||||
Non-recurring items (net)2 |
44.4 |
28.9 |
||||||
Recurring EBITDA |
925.5 |
847.3 |
||||||
The financial result also continued to improve compared to 2014. It amounted to minus EUR 126.4 million after minus EUR 134.4 million in the previous year. The financial result is composed of the interest result, other financial result and income from investments accounted for using the equity method:
- The main reason for the improvement in the financial result of 6.0 % or EUR 8.1 million was lower interest expenses. They declined by 7.9 % or EUR 8.0 million to minus EUR 93.4 million as a result of improved conditions for the existing syndicated facilities agreement. The Group practices proactive financial management and takes advantage of market windows of opportunity to secure attractive conditions for its financial debt instruments. In April 2015, the Company extended its existing syndicated facilities agreement by one year until 2020, thus securing favorable interest conditions.
- The other financial result remained essentially unchanged year-on-year at minus EUR 39.0 million (previous year: minus EUR 39.4 million). This item contains a number of impairments on financial investments totaling EUR 62.9 million (previous year: EUR 30.3 million), including on shares in ZeniMax Media Inc. in the amount of EUR 23.1 million, in AliphCom Inc. (Jawbone) in the amount of EUR 19.4 million and in Odyssey Music S.A. (Deezer) in amount of EUR 10.0 million. This was offset in particular by the remeasurement of the interests in SMARTSTREAM.TV and Collective Digital Studio that were previously accounted for using the equity method.
- Income from investments accounted for using the equity method increased to EUR 4.6 million (previous year: EUR 2.9 million).
As a result of the developments described above, earnings before taxes rose to EUR 603.6 million. This equates to a growth of 7.8 % or EUR 43.5 million.
Income tax expense amounted to EUR 207.7 million (previous year: EUR 178.6 million); the tax rate was 34.4 % (previous year: 31.9 %). The increase in the tax rate was primarily attributable to the reassessment of tax risks in connection with open assessment periods for previous tax years. Another reason for the increase is non-tax-deductible consulting costs in connection with the recent increase in M&A activities.
Despite increased tax expense, net profit for the period after taxes increased by 4.6 % to EUR 390.6 million; in financial year 2014, the corresponding profit figure amounted to EUR 373.5 million.
Underlying net income from continuing operations also increased significantly by 11.6 % to EUR 467.5 million (previous year: EUR 418.9 million). Basic underlying earnings per share rose by 11.4 % to EUR 2.19 (previous year: EUR 1.96). Specifically, the calculation of the underlying net income is as follows:
Reconciliation of underlying net income from continuing operations |
||||||
|
|
|
||||
EUR m |
2015 |
2014 |
||||
|
||||||
Consolidated net profit after non-controlling interests |
390.6 |
373.5 |
||||
Amortization from purchase price allocations (after tax)1 |
22.0 |
13.4 |
||||
Impairments on other financial investments |
39.4 |
19.5 |
||||
Reassessment of interests accounting for using the equity method in connection with first-time consolidations |
-26.4 |
-/- |
||||
Reassessment of tax risks |
19.6 |
-/- |
||||
Impairment of shares in ZeniMax Media Inc. |
23.1 |
7.3 |
||||
Release of deferred financing costs |
-/- |
5.4 |
||||
Other effects |
-0.8 |
-/- |
||||
Underlying net income |
467.5 |
418.9 |
||||
The result after taxes from discontinued operations amounted to minus EUR 0.3 million in 2015 (previous year: EUR -27.1 million). The full income statement of discontinued operations is presented in Note 7 “Acquisitions and disposals.”
Selected key figures of ProSiebenSat.1 Group for the 2015 financial year |
||||
|
|
|
||
|
ProSiebenSat.1 |
|||
EUR m |
2015 |
2014 |
||
Revenues |
3,260.7 |
2,875.6 |
||
Operating costs1 |
2,354.5 |
2,046.9 |
||
Total costs |
2,555.4 |
2,209.0 |
||
Cost of sales |
1,763.9 |
1,560.4 |
||
Selling expenses |
371.5 |
312.2 |
||
Administrative expenses |
412.5 |
331.5 |
||
Other operating expenses |
7.6 |
4.8 |
||
EBIT |
729.9 |
694.5 |
||
Recurring EBITDA2 |
925.5 |
847.3 |
||
Non-recurring items (net)3 |
-44.4 |
-28.9 |
||
EBITDA |
881.1 |
818.4 |
||
Consolidated net profit attributable to shareholders of ProSiebenSat.1 Media SE |
390.6 |
373.5 |
||
Underlying net income4 |
467.5 |
418.9 |
||
Selected key figures of ProSiebenSat.1 Group for the fourth quarter of 2015 |
||||||||||||||
|
|
|
||||||||||||
|
ProSiebenSat.1 |
|||||||||||||
EUR m |
Q4 2015 |
Q4 2014 |
||||||||||||
|
||||||||||||||
Revenues |
1,086.5 |
965.9 |
||||||||||||
Operating costs1 |
735.4 |
645.6 |
||||||||||||
Total costs |
809.0 |
694.2 |
||||||||||||
Cost of sales |
545.2 |
490.8 |
||||||||||||
Selling expenses |
124.2 |
99.8 |
||||||||||||
Administrative expenses |
135.3 |
101.8 |
||||||||||||
Other operating expenses |
4.3 |
1.8 |
||||||||||||
EBIT |
288.7 |
281.8 |
||||||||||||
Recurring EBITDA2 |
357.4 |
325.1 |
||||||||||||
Non-recurring items (net)3 |
-14.1 |
-8.2 |
||||||||||||
EBITDA |
343.3 |
316.9 |
||||||||||||
Consolidated net profit attributable to shareholders of ProSiebenSat.1 Media SE |
138.5 |
167.8 |
||||||||||||
Underlying net income4 |
201.1 |
180.4 |
||||||||||||