
Group Financial Position and Performance
- ProSiebenSat.1 further optimizes its Group-wide corporate financing and increases the volume of the term loan to EUR 2.100 billion.
- Leverage ratio remains in target range of 1.5 to 2.5 despite M&A measures.
- Investment cash flow amounts to minus EUR 1.522 billion due to acquisitions.
- Cash and cash equivalents rise by 56.1 % to EUR 734.4 million, after a strong fourth quarter.
Borrowings and Financing Structure
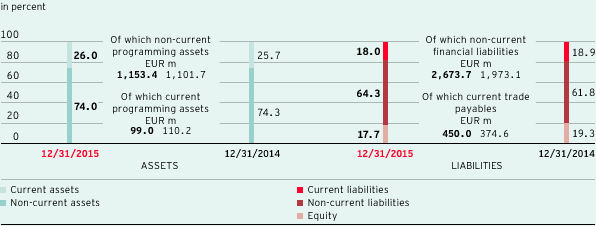
As of December 31, 2015, ProSiebenSat.1 Group’s debt capital amounted to EUR 4.374 billion (December 31, 2014: EUR 3.147 billion) and thus had a share of 82.3 % in total assets (December 31, 2014: 80.7 %). With 61.1 % or EUR 2.674 billion, non-current financial liabilities had the largest share in debt capital (December 31, 2014: 62.7 % or EUR 1.973 billion). Current financial liabilities amounted to EUR 1.1 million; there was no corresponding item on the previous year’s reporting date.
Rating of ProSiebenSat.1 Group: Ratings represent an independent assessment of a company’s credit quality. The rating agencies do not take ProSiebenSat.1 Group’s facilities agreement or notes into account in their credit ratings.
As of December 31, 2015, the unsecured facilities agreement comprised a term loan of EUR 2.100 billion and a revolving credit facility (RCF) of EUR 600.0 million. In the second quarter of 2015, ProSiebenSat.1 Group extended its facilities agreement by one year to April 2020. The ProSiebenSat.1 Group pursues an active financial management and could benefit from the favorable market environment in the financial markets. Furthermore, the Group has unsecured notes in the amount of EUR 600.0 million, which are listed on the regulated market of the Luxembourg stock exchange (ISIN DE000A11QFA7). The following graph provides an overview of debt financial instruments as of the 2015 closing date according to maturity:
Debt financial instruments and maturities as of December 31, 2015
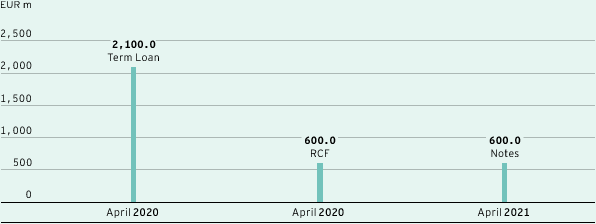

In October 2015, ProSiebenSat.1 increased the term loan by EUR 700.0 million to EUR 2.100 billion (December 31, 2014: EUR 1.400 billion). The term loan increase serves for general corporate purposes. The amounts of the other instruments have not changed compared to the same date of the previous year. As in the previous year, no drawings had been made on the RCF as of December 31, 2015.
Amounts drawn under the RCF and interest payable on the term loan are variable. ProSiebenSat.1 Group therefore hedges potential risks from changes of variable interest rates with derivative financial instruments in the form of interest rate swaps and interest rate options. The hedge ratio or proportion of fixed interest remains high at approximately 78 % (previous year: approx. 95 %) in relation to the entire long-term financing portfolio. The average fixed-interest swap rate is still around 3.12 % per annum. The fixed-rate coupon of the notes is 2.625 % per annum.
ProSiebenSat.1 Group has also concluded lease contracts for property at the Unterföhring site. In line with IFRS, these are largely classified as finance leases. This real estate is capitalized as property, plant and equipment and the respective leasing obligations are recognized as other financial liabilities. The real estate leases end in 2019 at the earliest. There are also smaller-scale leases for technical equipment. ProSiebenSat.1 Group reported liabilities for finance leases totaling EUR 82.2 million as of December 31, 2015 (previous year: EUR 89.2 million). There were no other significant off-balance sheet financing instruments.
Group-wide corporate financing |
|
On April 2, 2014, as part of a comprehensive refinancing, ProSiebenSat.1 Group concluded a new syndicated loan agreement for EUR 2.000 billion with a five-year term to April 2019. This new unsecured facilities agreement comprised a term loan of EUR 1.400 billion and a revolving credit facility of EUR 600.0 million. ProSiebenSat.1 also issued seven-year notes in the amount of EUR 600.0 million in the context of Group refinancing. The notes are also unsecured and will mature in April 2021. |
The proceeds of the notes and the new term loan were used to repay the secured term loan in the amount of EUR 1.860 billion. The new term loan is also being used for general operating purposes. |
In the financial year 2015, ProSiebenSat.1 extended the tenor of the facilities agreement by one year to April 2020 and increased the term loan from EUR 1.400 billion to EUR 2.100 billion. |
The facilities agreement contains provisions that require ProSiebenSat.1 to comply with certain key financial figures (financial covenant), which are subject to regular reviews. Thus, ProSiebenSat.1 Group has to satisfy a certain ratio of the consolidated net debt to the consolidated EBITDA (as defined in the contract). ProSiebenSat.1 Group complied with the contractual requirements in financial year 2015. |
In the event that the control over ProSiebenSat.1 Media SE changes by way of direct or indirect acquisition of more than 50 % of the voting rights in ProSiebenSat.1 Media SE by a third party (“change of control”), the lenders are entitled to terminate their participation in the facility and to demand repayment of outstanding amounts allocable to them within a certain period after the change of control takes place. If a negative rating event occurs following such a change of control, the note creditors are also entitled to call in their notes and demand repayment. |
Financing Analysis
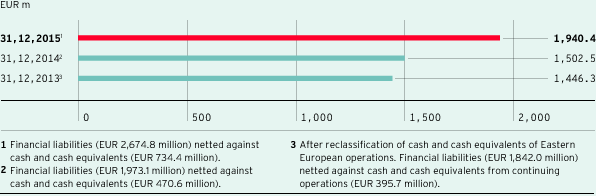
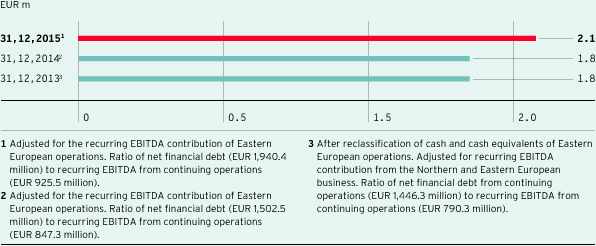
Net financial debt is defined as total borrowings minus cash and cash equivalents and certain current financial assets. It amounted to EUR 1.940 billion as of December 31, 2015. Due to increased M&A activities, net financial debt rose by EUR 437.9 million compared to December 31, 2014. As of the end of the year, cash and cash equivalents amounted to EUR 734.4 million compared to EUR 470.6 million on December 31, 2014. The leverage ratio shows net financial debt in relation to recurring EBITDA of the last twelve months (LTM recurring EBITDA) and is a key indicator for Group-wide financial planning. It was 2.1 as of December 31, 2015. The ratio was at 1.8 times on December 31, 2014. Thus, ProSiebenSat.1 Group’s leverage ratio is within the defined target range of 1.5 and 2.5 times.
Group net financial debt

Ratio net financial debt to LTM recurring EBITDA (leverage ratio)

Principles and objectives of financial management |
||
|
||
The Company’s financial management is centrally run by the Group Finance & Treasury department. This department manages financial management throughout the Group and pursues the following objectives: |
||
> |
to secure the Group’s financial flexibility and stability, in other words, maintaining and optimizing its funding ability, |
|
> |
to ensure that the entire Group remains solvent by managing its liquidity efficiently across the organization, |
|
> |
to manage its financial risks by using derivative financial instruments. |
|
The Group financial management covers the capital structure management and Group-wide funding, cash and liquidity management, and the management of market price risks, counterparty risks and credit default risks. This includes the following tasks: |
||
> |
Capital structure: In connection with capital structure management at ProSiebenSat.1 Group, managing financial leverage (leverage ratio) is given particular priority. The Group has defined a target range of 1.5 to 2.5 and takes into account factors such as the level of market receptivity, funding terms and conditions, flexibility or restrictions, diversification of the investor base and maturity profiles when choosing suitable financing instruments. ProSiebenSat.1 Group manages its funding on a centralized basis. |
|
> |
Cash and liquidity management: As part of its cash and liquidity management, the Group optimizes and centralizes cash flows and secures liquidity across the Group. Cash pooling is an important tool here. Using rolling, Group-wide liquidity planning ProSiebenSat.1 Group captures and forecasts both operating cash flows and cash flows from non-operating activities, thus deriving liquidity surpluses or requirements. Liquidity requirements are covered either by existing cash positions or the revolving credit facility (RCF). |
|
> |
Management of market price risks: The management of market price risks comprises centrally managed interest rate and currency management. Cash instruments as well as derivatives such as conditional and unconditional forward transactions are deployed. These instruments are used exclusively for hedging purposes and serve to limit the effects of interest and currency volatility to Group profit and cash flow. |
|
> |
Management of counterparty and credit default risks: The management of counterparty and credit default risks centers on trading relationships and creditor exposure to financial institutions. When entering into trading transactions, ProSiebenSat.1 Group pays attention to ensuring that business is widely diversified involving counterparties of sufficiently high credit quality. For this purpose, the Group draws on external ratings supplied by international agencies. The Group’s risk with respect to financial institutions arises primarily from its investment of cash and cash equivalents and from its use of derivatives as part of its interest-rate and currency management activities. |
|
Analysis of Liquidity and Capital Expenditure
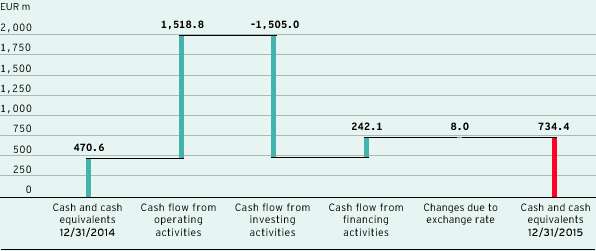
ProSiebenSat.1 Group’s cash flow statement shows the generation and use of cash flows. It is broken down into cash flow from operating activities, cash flow from investing activities and cash flow from financing activities. Cash and cash equivalents shown in the cash flow statement correspond to cash and cash equivalents reported in the statement of financial position as of December 31, 2015, and December 31, 2014, respectively.
Cash flow statement |
||||||||||
|
|
|
|
|
||||||
EUR m |
Q4 2015 |
Q4 2014 |
2015 |
2014 |
||||||
|
||||||||||
Result from continuing operations |
139.4 |
169.4 |
395.9 |
381.5 |
||||||
Result from discontinued operations |
3.2 |
–18.4 |
0.3 |
–27.1 |
||||||
Cash flow from continuing operations |
617.7 |
572.5 |
1,784.6 |
1,690.0 |
||||||
Cash flow from discontinued operations |
–2.3 |
-2.3 |
–2.1 |
-4.6 |
||||||
Change in working capital |
-46.8 |
9.9 |
–12.0 |
–12.2 |
||||||
Dividends received |
0.4 |
0.1 |
6.6 |
5.7 |
||||||
Taxes paid |
–57.9 |
–41.2 |
–177.8 |
–163.4 |
||||||
Interest paid |
–18.2 |
–17.9 |
–81.5 |
–91.2 |
||||||
Interest received |
0.5 |
1.8 |
0.6 |
2.1 |
||||||
Payments for financing costs from derivatives |
–/– |
–/– |
–/– |
-6.3 |
||||||
Cash flow from operating activities of continuing operations |
495.7 |
525.2 |
1,520.5 |
1,424.8 |
||||||
Cash flow from operating activities discontinued operations |
–0.1 |
-0.1 |
-1.7 |
19.5 |
||||||
Cash flow from investing activities of continuing operations |
–418.8 |
–227.9 |
–1,521.7 |
–1,148.4 |
||||||
Cash flow from investing activities discontinued operations |
16.7 |
–2.4 |
16.7 |
-25.2 |
||||||
Free cash flow from continuing operations |
76.9 |
297.3 |
-1.2 |
276.5 |
||||||
Free cash flow from discontinued operations |
16.5 |
–2.6 |
15.0 |
-5.7 |
||||||
Free cash flow (total) |
93.4 |
294.7 |
13.8 |
270.7 |
||||||
Cash flow from financing activities of continuing operations |
417.5 |
–2.7 |
242.1 |
–208.3 |
||||||
Cash flow from financing activities discontinued operations |
–/– |
–/– |
–/– |
–/– |
||||||
Effect of foreign exchange rate changes of continuing operations on cash and cash equivalents |
0.0 |
1.9 |
8.0 |
4.0 |
||||||
Effect of foreign exchange rate changes of discontinued operations on cash and cash equivalents |
–/– |
–/– |
–/– |
–0.3 |
||||||
Change in cash and cash equivalents |
510.9 |
293.8 |
263.8 |
66.1 |
||||||
Cash and cash equivalents at beginning of reporting period |
223.5 |
176.8 |
470.6 |
404.51 |
||||||
Cash and cash equivalents at end of reporting period |
734.4 |
470.6 |
734.4 |
470.6 |
||||||
Cash flow from operating activities: In the financial year 2015, ProSiebenSat.1 Group generated an operating cash flow of EUR 1.521 billion compared to EUR 1.425 billion in the previous year. This equates to growth of 6.7 %. The increase is partly attributable to the positive earnings performance. Lower interest payments also had an effect; these fell by 10.6 % or EUR 9.7 million year-on-year to EUR 81.5 million. This decline is primarily attributable to improved conditions for the existing syndicated facilities agreement. Higher tax payments had a contrary effect. They amounted to EUR 177.8 million compared to EUR 163.4 million in the previous year.
Cash flow from investing activities: The core area of investing activities within ProSiebenSat.1 is the acquisition of programming rights. Cash outflow for the acquisition of programming rights amounted to EUR 943.9 million. This equates to an increase of 6.1 % or EUR 54.2 million (previous year: EUR 889.7 million). The programming investments were mostly made in the Broadcasting German-speaking segment; 53 % were with regards to the acquisition of licensed programming and 47 % to commissioned productions. Alongside the purchase of licensed formats and commissioned productions, the Group’s programming supply is ensured by in-house formats. In-house formats are based on the development and implementation of own ideas and, unlike commissioned productions, are primarily produced for broadcasting in the near future. For this reason, they are recognized immediately as an expense in the cost of sales and are not considered an investment.
In the past financial year, besides investments in programming assets, EUR 84.1 million was invested in other intangible assets, an increase of 26.6 % or EUR 17.7 million compared to the prior year figure. By investing in other intangible assets, the Group primarily strengthened the segments Digital & Adjacent (56.5 %) and Broadcasting German-speaking (31.5 %). ProSiebenSat.1 mainly invested in internally generated intangible assets and from advance payments for intangible assets and software licenses. At EUR 38.4 million, investments in property, plant and equipment were 17.3 % or EUR 5.7 million higher than the previous year’s figure of EUR 32.8 million. Most of the investments (72.5 %) were made in the Broadcasting German-speaking segment and related to technical equipment, leasehold improvements at the Unterföhring site and advance payments for property, plant and equipment.
Assets resulting from firsttime consolidations are not reported as segmentspecific investments. Funds used for the acquisition of the first-time consolidated companies are shown as “cash outflow from additions to the scope of consolidation.”
At the same time, cash outflow from additions to the scope of consolidation increased considerably to EUR 425.6 million in 2015 (previous year: EUR 122.2 million). The cash outflow primarily reflects the portfolio expansions in the Digital & Adjacent segment, in which Verivox, etraveli and Collective Digital Studio were the largest acquisitions.
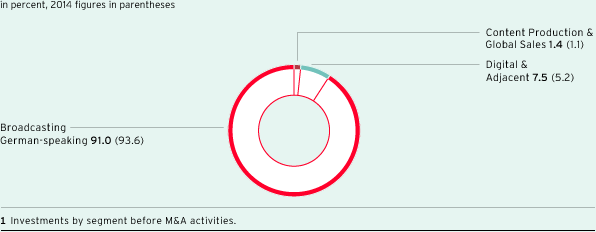
For financial year 2015, the described cash flows from investing activities resulted in a total investment cash flow of minus EUR 1.522 billion (+32.5 % or EUR -373.4 million year-on-year). The following chart provides a breakdown of investments by segment:
Investments by segment 1

Free cash flow: Free cash flow fell to minus EUR 1.2 million in financial year 2015 (previous year: EUR 276.5 million). The decline is primarily attributable to the considerable increase in the volume of investment in connection with company acquisitions and investments.
Cash flow from financing activities: Cash flow from financing activities was EUR 242.1 million after cash outflow of EUR 208.3 million in the previous year. The payment of the dividend for financial year 2014 resulted in cash outflow of EUR 341.9 million in May 2015. This was offset by a net cash inflow of EUR 617.1 million particularly due to the increase of the term loan in October by EUR 700.0 million. The cash outflow for 2014 reflected the dividend distribution (EUR 313.4 million) and net cash inflow of EUR 116.3 million relating to refinancing measures. In April 2014, ProSiebenSat.1 concluded a new syndicated facilities agreement with a volume of EUR 2.000 billion at attractive conditions and repaid a portion of its loans; the Group issued a bond at the same time.
Cash and cash equivalents: In financial year 2015, the overall cash flows described resulted in an increase of cash and cash equivalents compared to the previous year’s reporting date. At EUR 734.4 million, the cash and cash equivalents were 56.1 % or EUR 263.8 million higher than the previous year’s figure of EUR 470.6 million. The Group reported particularly high inflow of cash and cash equivalents in the high-revenue fourth quarter; the figure amounted to EUR 510.9 million after EUR 293.8 million in the fourth quarter of 2014.
Changes in cash and cash equivalents

Analysis of Assets and Capital Structure
As of December 31, 2015, total assets amounted to EUR 5.317 billion compared to EUR 3.901 billion on December 31, 2014. The 36.3 % increase primarily resulted from higher goodwill, other intangible and financial assets and a higher level of cash and cash equivalents.
Structure of the Statement of Financial Position

Significant individual value changes to different items of the statement of financial position compared to December 31, 2014, are described below:
The goodwill recorded an increase of 58.0 % to EUR 1.656 billion as of December 31, 2015 (December 31, 2014: EUR 1.048 billion). This is due to the first-time consolidation of the majority interests acquired in 2015, including Verivox, etraveli and Collective Digital Studio. Accordingly, the share of the goodwill in total assets increased to 31.1 % as of December 31, 2015 (December 31, 2014: 26.9 %).
As of December 31, 2015, other intangible assets increased by EUR 293.1 million to EUR 552.8 million (December 31, 2014: EUR 259.8 million). Main reasons for this were the purchase price allocations related to the acquisitions in the last financial year.
Non-current other financial and non-financial assets rose considerably by EUR 84.8 million to EUR 307.0 million as of December 31, 2015 (December 31, 2014: EUR 222.1 million). This was primarily the result of positive effects from currency hedges.
Non-current and current programming assets increased slightly compared to December 31, 2015. They increased by 3.3 % and amounted to EUR 1.252 billion (December 31, 2014: EUR 1.212 billion). This equates to a 23.6 % share of total assets (December 31, 2014: 31.1 %). Alongside the goodwill, programming assets are among ProSiebenSat.1’s most important assets.
Trade receivables increased by a total of 20.5 % or EUR 65.2 million to EUR 383.3 million.
Current other financial and non-financial assets rose considerably to EUR 137.5 million (December 31, 2014: EUR 75.2 million). This equates to an increase of 82.8 % or EUR 62.3 million, which is mainly attributable to positive effects from currency hedges.
Cash and cash equivalents increased to EUR 734.4 million as of the reporting date, an increase of 56.1 % or EUR 263.8 million.
In the reporting period, equity rose by 25.1 % to EUR 943.1 million (December 31, 2014: EUR 753.9 million). A positive impact was made by the consolidated profit of EUR 396.2 million and the EUR 140.9 million increase in other accumulated equity. This was counteracted by the dividend payment of EUR 341.9 million. Despite the positive development, the equity ratio fell slightly to 17.7 % (December 31, 2014: 19.3 %) due to the increased debt capital. The Group continues to have a solid financial position.
As of December 31, 2015, non-current and current liabilities and provisions increased to a total of EUR 4.374 billion (December 31, 2014: EUR 3.147 billion), a rise of 39.0 %. The increase is mainly due to the increase of the term loan by EUR 700.0 million in the fourth quarter of 2015. The outstanding contingent purchase price components for majority interests acquired in 2015 and deferred taxes from the purchase price allocations of the acquisitions also led to the increase.
As of December 31, 2015, there were no other major structural or quantitative changes of the statement of financial position year-on-year.
Accounting assumptions and estimates |
|
When applying accounting principles, recognizing income and expenses and preparing balance sheet reports, assumptions and estimates need to be made to a certain extent. Detailed information on the use of assumptions and estimates are shown in Note 2 of the consolidated financial statements. |